 Scene
Scene


 1st Slide
 Branching Point
 Module: Kosmische Hintergrundstrahlung
 Sequence: Start
 Branching Point: The Most Ancient Radiation in the Universe
 Slide: Where Everything Started From
 Back
Back


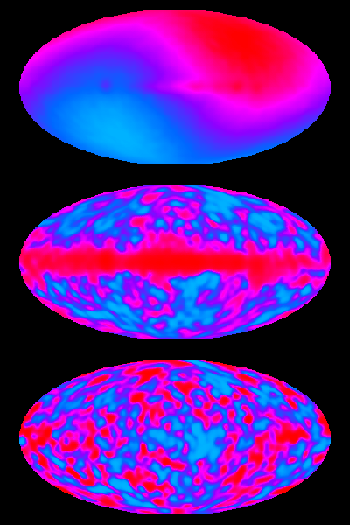
These sky maps are the most prominent results obtained by COBE satellite. They were released in 1992. The colour scale represents a temperature scale, being blue for colder and red for hotter spots.
In the first map from the top, temperature fluctuations are covered by a dipole effect, due to the Earth’s motion.
In the second one, the dipole effect has been canceled. The red (hotter) central strip corresponds to the position of the Milky Way in the sky.
The last more detailed map is obtained by cancelling out all external disturbing factors.