Astrophysik: Gravitationsdetektoren
 Scene
Scene


 1st Slide
 Branching Point
 Module: Astrophysik: Gravitationsdetektoren
 Sequence: Gravitationswellendetektoren Einstieg
 Branching Point: Gravitational wave detectors
 Slide: Detecting gravitational waves

So what's on the screen above this media station?
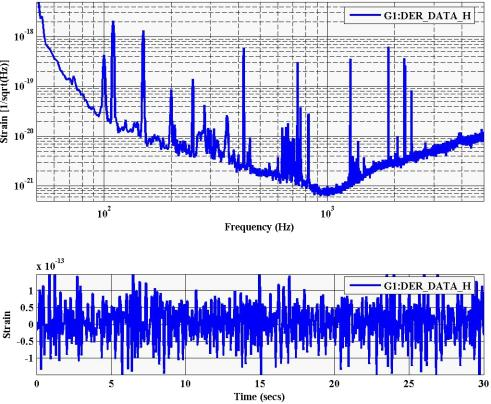
The screen shows raw data from one of the science runs of the gravitational wave detector GEO 600. Data like this is displayed on the screens of the experimental physicists in charge of detector operations. The bottom graph shows the current changes in the distances between the detector's optical elements. If the blue curve reaches the line marked 1, that corresponds to a stretching/shrinking of distances by one tenth of a thousandth of a billionth. However, the values of the blue curve that can be seen here are almost exclusively due to the many kinds of perturbations present in the detector. The changes caused by gravitational waves would be roughly another billion times smaller.
[ Sitemap ]
[ info ] This website was created by the MPI for the History of Science.