Astrophysik: Gravitationsdetektoren
 Scene
Scene


 1st Slide
 Branching Point
 Module: Astrophysik: Gravitationsdetektoren
 Sequence: Gravitationswellendetektoren Einstieg
 Branching Point: Gravitational wave detectors
 Slide: Detecting gravitational waves
 Back
Back


A measure of sensitivity
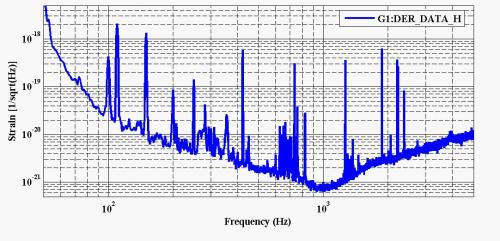
Precisely because this signal is a result of all the different perturbations acting on the detector, it contains valuable information: By examining it, the physicists can tell the current sensitivity of their detector. As a tool, they use the diagram shown above. It shows the magnitude of the perturbations at different frequencies. For instance, the height of the curve above the point of the horizontal axis marked as 102 shows the magnitude of perturbations interfering with the detection of gravitational waves with a frequency of 100 Hertz. Thus, the curve is a measure for the detector's sensitivity - the smaller the perturbations at a given frequency, the weaker the gravitational waves of that frequency that can still be detected.
[ Sitemap ]
[ info ] This website was created by the MPI for the History of Science.